


NASDAQ Pullback and Seasonal Patterns
July 21, 2024 Update

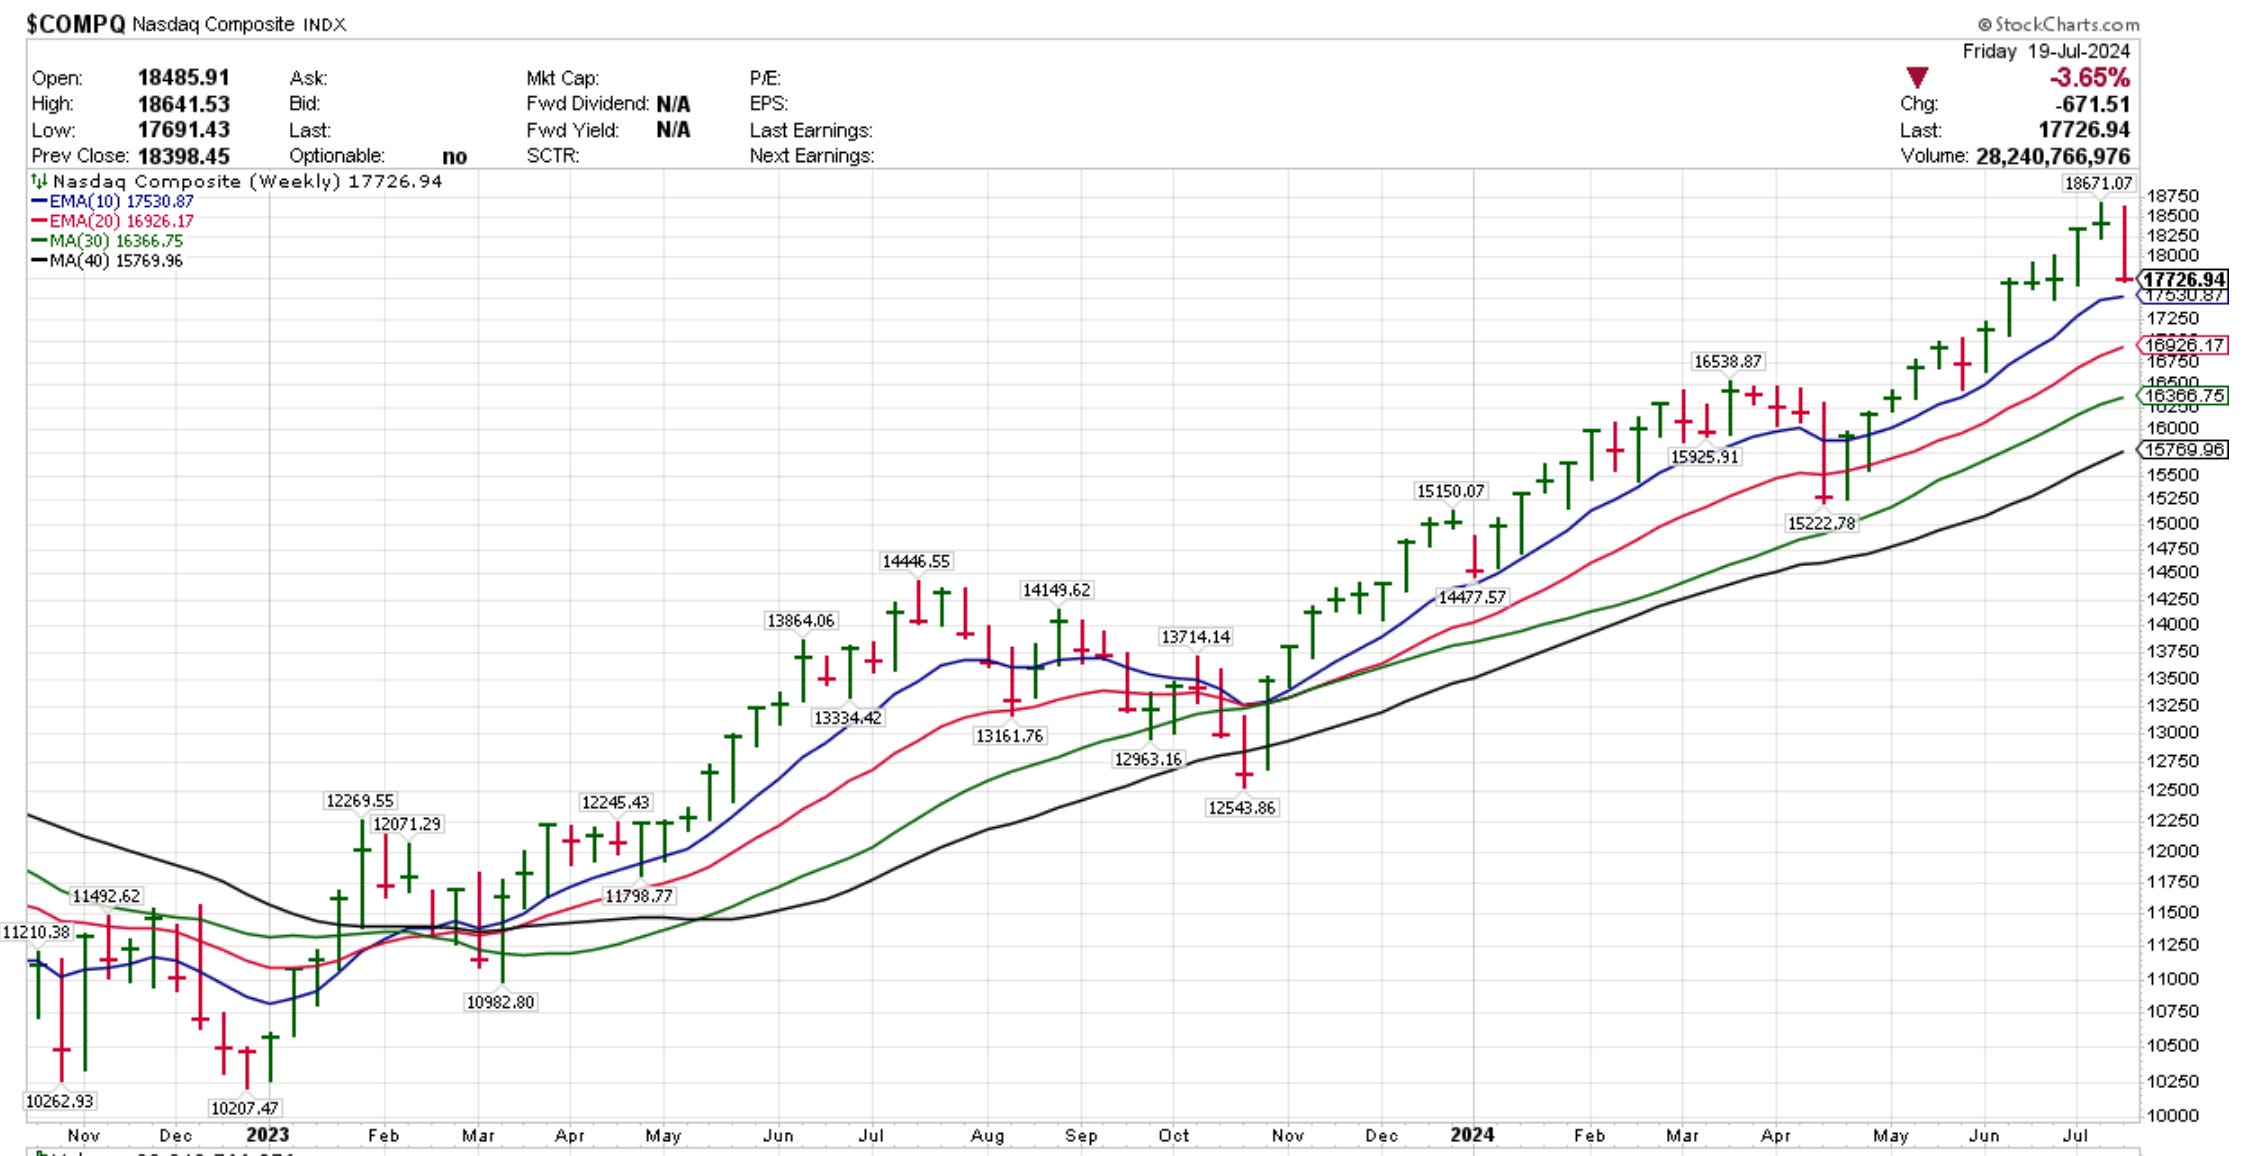
The Nasdaq closed at -3.65% for the week driven by a strong correction in Tech, especially in semiconductors. On the weekly, the NASDAQ remains above all moving averages and it looks like a normal pullback in the context of an uptrend. To be noticed the ugly closing bar though, as we closed at the low of the bar with no signs of buyers at the close.
NASDAQ WEEKLY CHART
NASDAQ DAILY CHART
On the daily is more apparent the strong and quick reversal with the 10 and 21 days moving averages heading down. A chart that looks ugly too. At least, the volume was getting lighter on Friday.
Keep reading with a 7-day free trial
Subscribe to 10X CAPITAL POT to keep reading this post and get 7 days of free access to the full post archives.