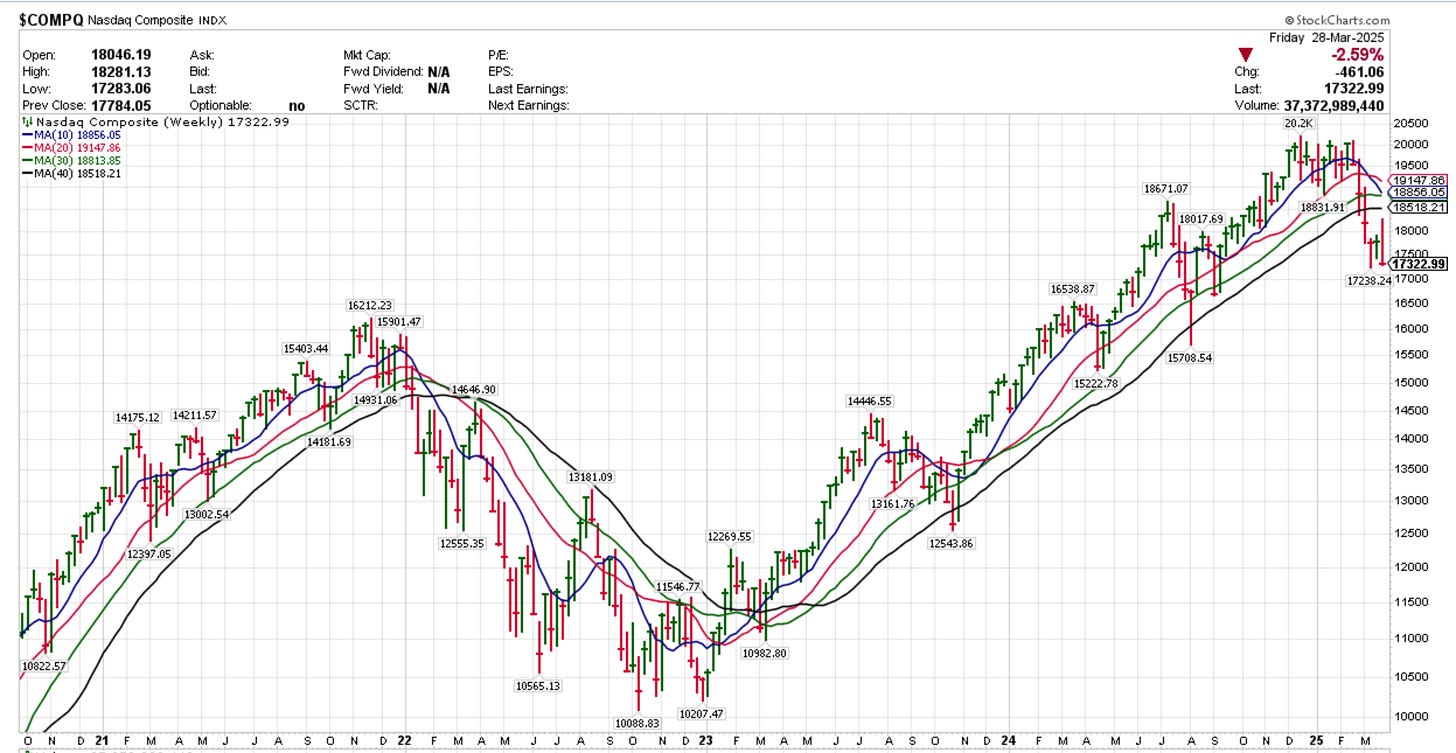
Let’s start with the Index. Take a look at the NASDAQ weekly chart below — it's telling quite a story. We closed the week down -2.6%, marked by a classic bearish engulfing candle. Not great.
The short-term moving averages are flashing warnings:
The 10-week and 20-week SMAs are sloping downward.
The 30-week and 40-week SMAs? Flattening.
This is not the setup you want to see if you're hoping for a trend reversal. The NASDAQ is now down roughly -13.5% from its peak back on February 10th and sits about 6% below its 40-week moving average — a level we haven't touched in two years.
📌 Stage 4 Breakdown
For the chart readers and Stan Weinstein fans out there, yes — we're in Stage 4 territory. More: https://traderlion.com/trading-strategies/stage-analysis/
💡 Macro View: Surprisingly Optimistic
Despite the ugly technicals, I'm not ready to sound the alarm on the eco…
Keep reading with a 7-day free trial
Subscribe to 10X CAPITAL POT to keep reading this post and get 7 days of free access to the full post archives.


