

🌍 Macro
The economy got stronger. That’s the problem (!).
August payrolls came in at +162K against a 53K forecast. June and July were revised up. Unemployment held at 4.1%. ISM Services printed 55.4.
No slowdown. Which removes the last argument against a rate hike. Futures now price a 58% chance of a hike on 16 September — it was 35% three weeks ago.
But the Fed’s two inflation gauges are telling opposite stories:
Core CPI: 2.38% — falling
Core PCE: 3.49% — rising
Core PCE is what the Fed officially targets. Core CPI is what everyone quotes.
Zoom in and it gets clearer. Annualised over Q3, headline CPI is running at 1.27% and core CPI at 1.91%. Truflation, which tracks live prices daily, sits at 2.28%. On today’s actual prices, inflation is at or below target.
The scary 3.4% headline is last year’s energy spike still in the base — plus Brent back at $97, up 34% since July.
So the Fed is choosing which measure to believe. Believe PCE, you hike. Believe CPI and the live data, you hold. That’s the whole debate, and it’s why the odds have swung from 35% to 64% to 50% to 58% in three weeks.
CPI lands 11 September. FOMC on the 16th. This is a coin flip.
The 10-year sits at 4.78%, a cycle high. The risk here isn’t earnings — S&P 500 earnings are growing 29% and accelerating. The risk is the multiple.
So, the FOMC meeting on the 16th will be very telling for the market.
📊 Index
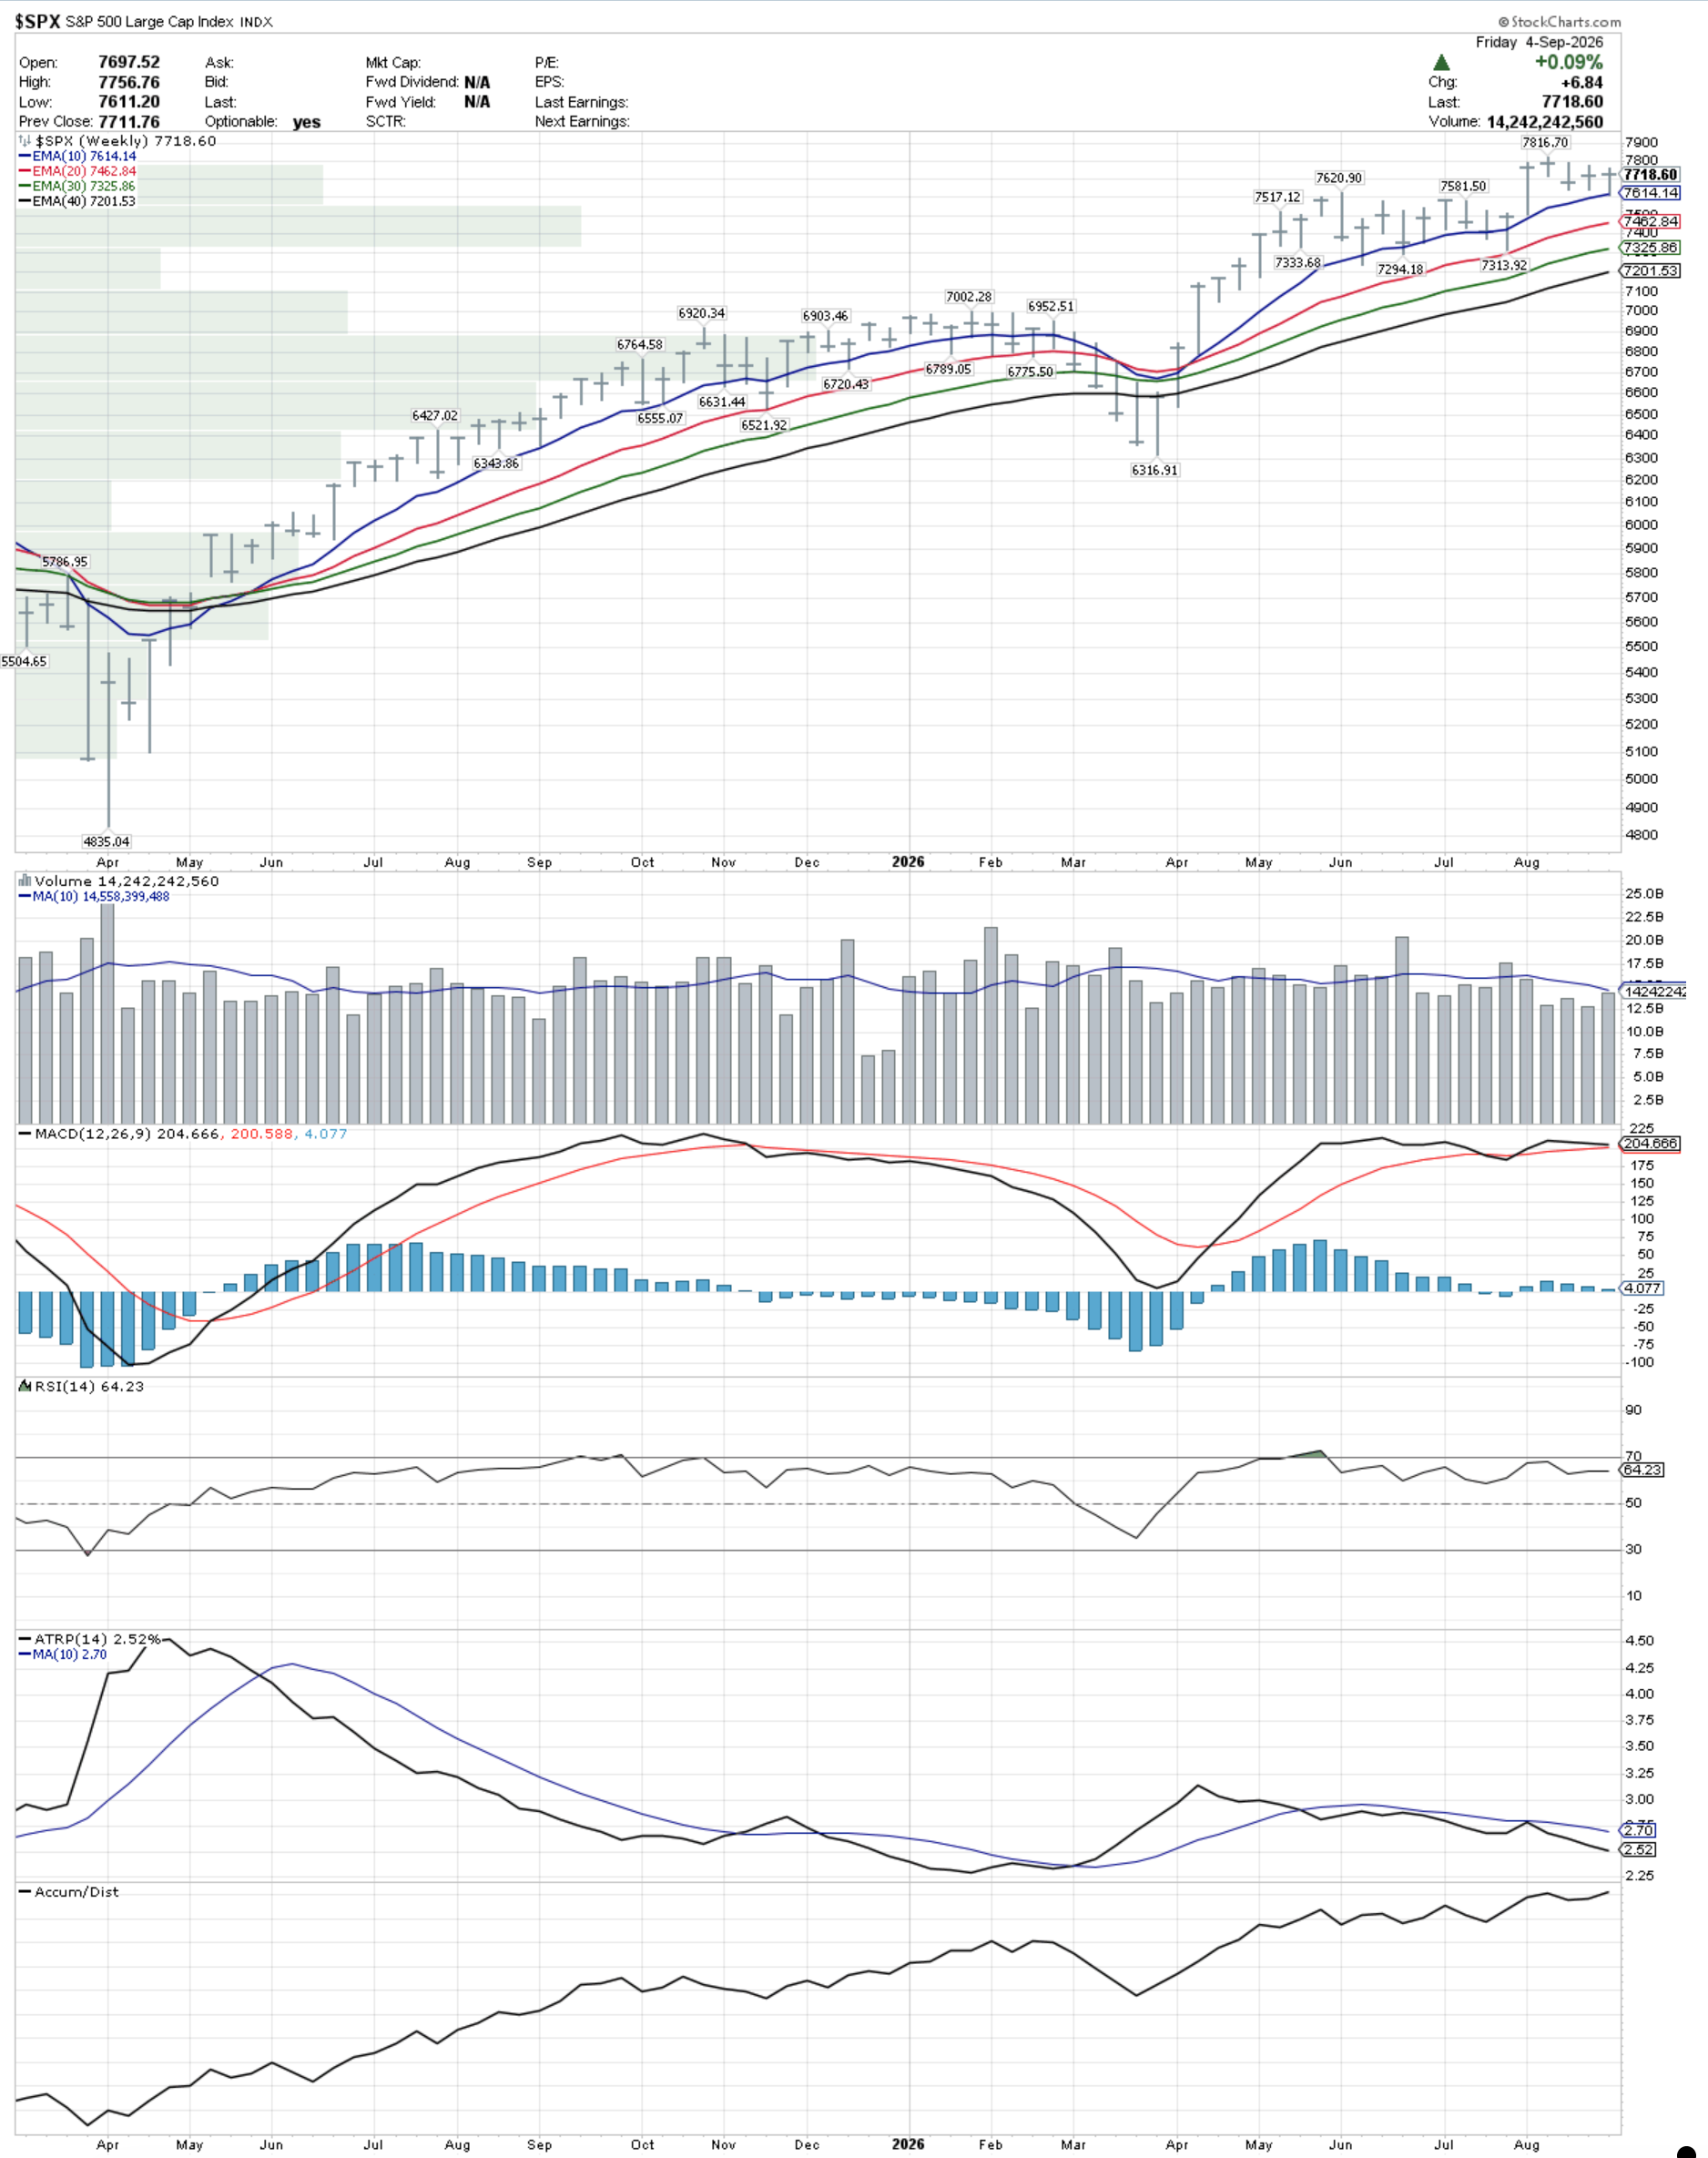
S&P closed at 7,718.60, 1.2% off the high. Boring week. Interesting chart.
Intact: all four weekly EMAs stacked and rising — textbook Stage 2. Accumulation/Distribution at new highs, so nobody is selling into this.
Flashing: MACD histogram at +4.08, one down week from a bearish cross. RSI at 64, below its June peak. Volatility compressing. Volume below average.
The read: a coiled spring, not a top. A tightening range inside an intact uptrend, winding up into a binary event.
🔄 Sectors & Themes
This isn’t a market turning defensive. It’s a market getting narrow.
One number proves it. Over three months, Technology is +3.87% cap-weighted but −2.93% for the average stock. A 6.8-point gap. The typical tech stock has been falling for a quarter while the sector looks green.
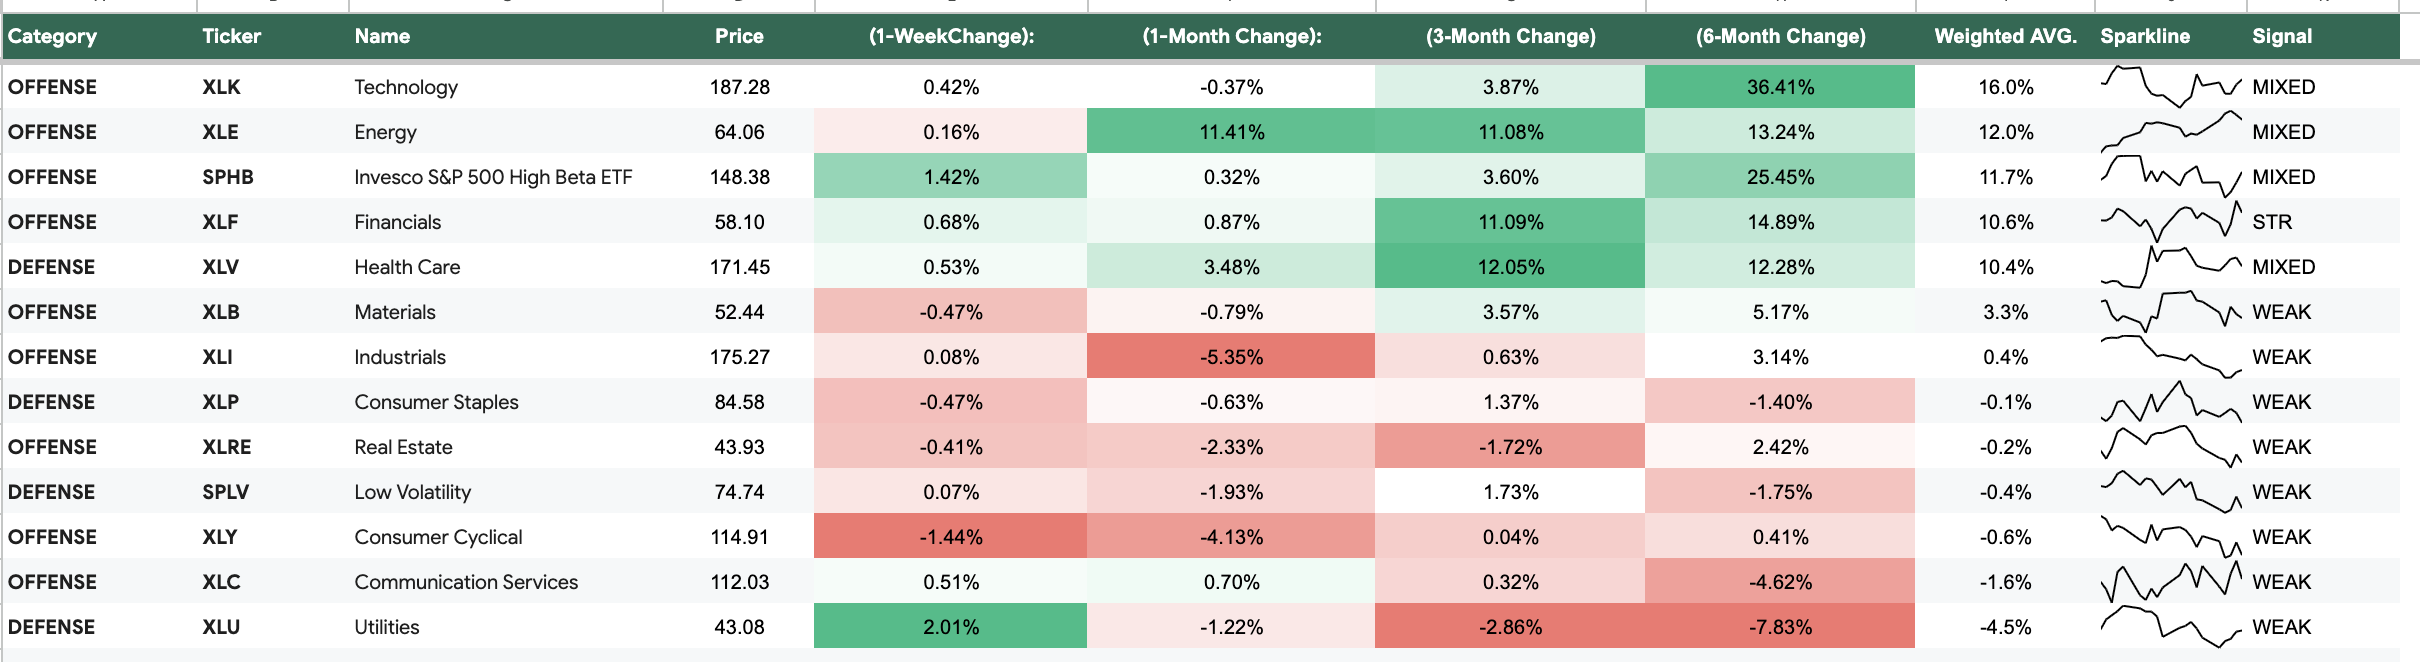
And the rotation happened inside growth, not out of it:
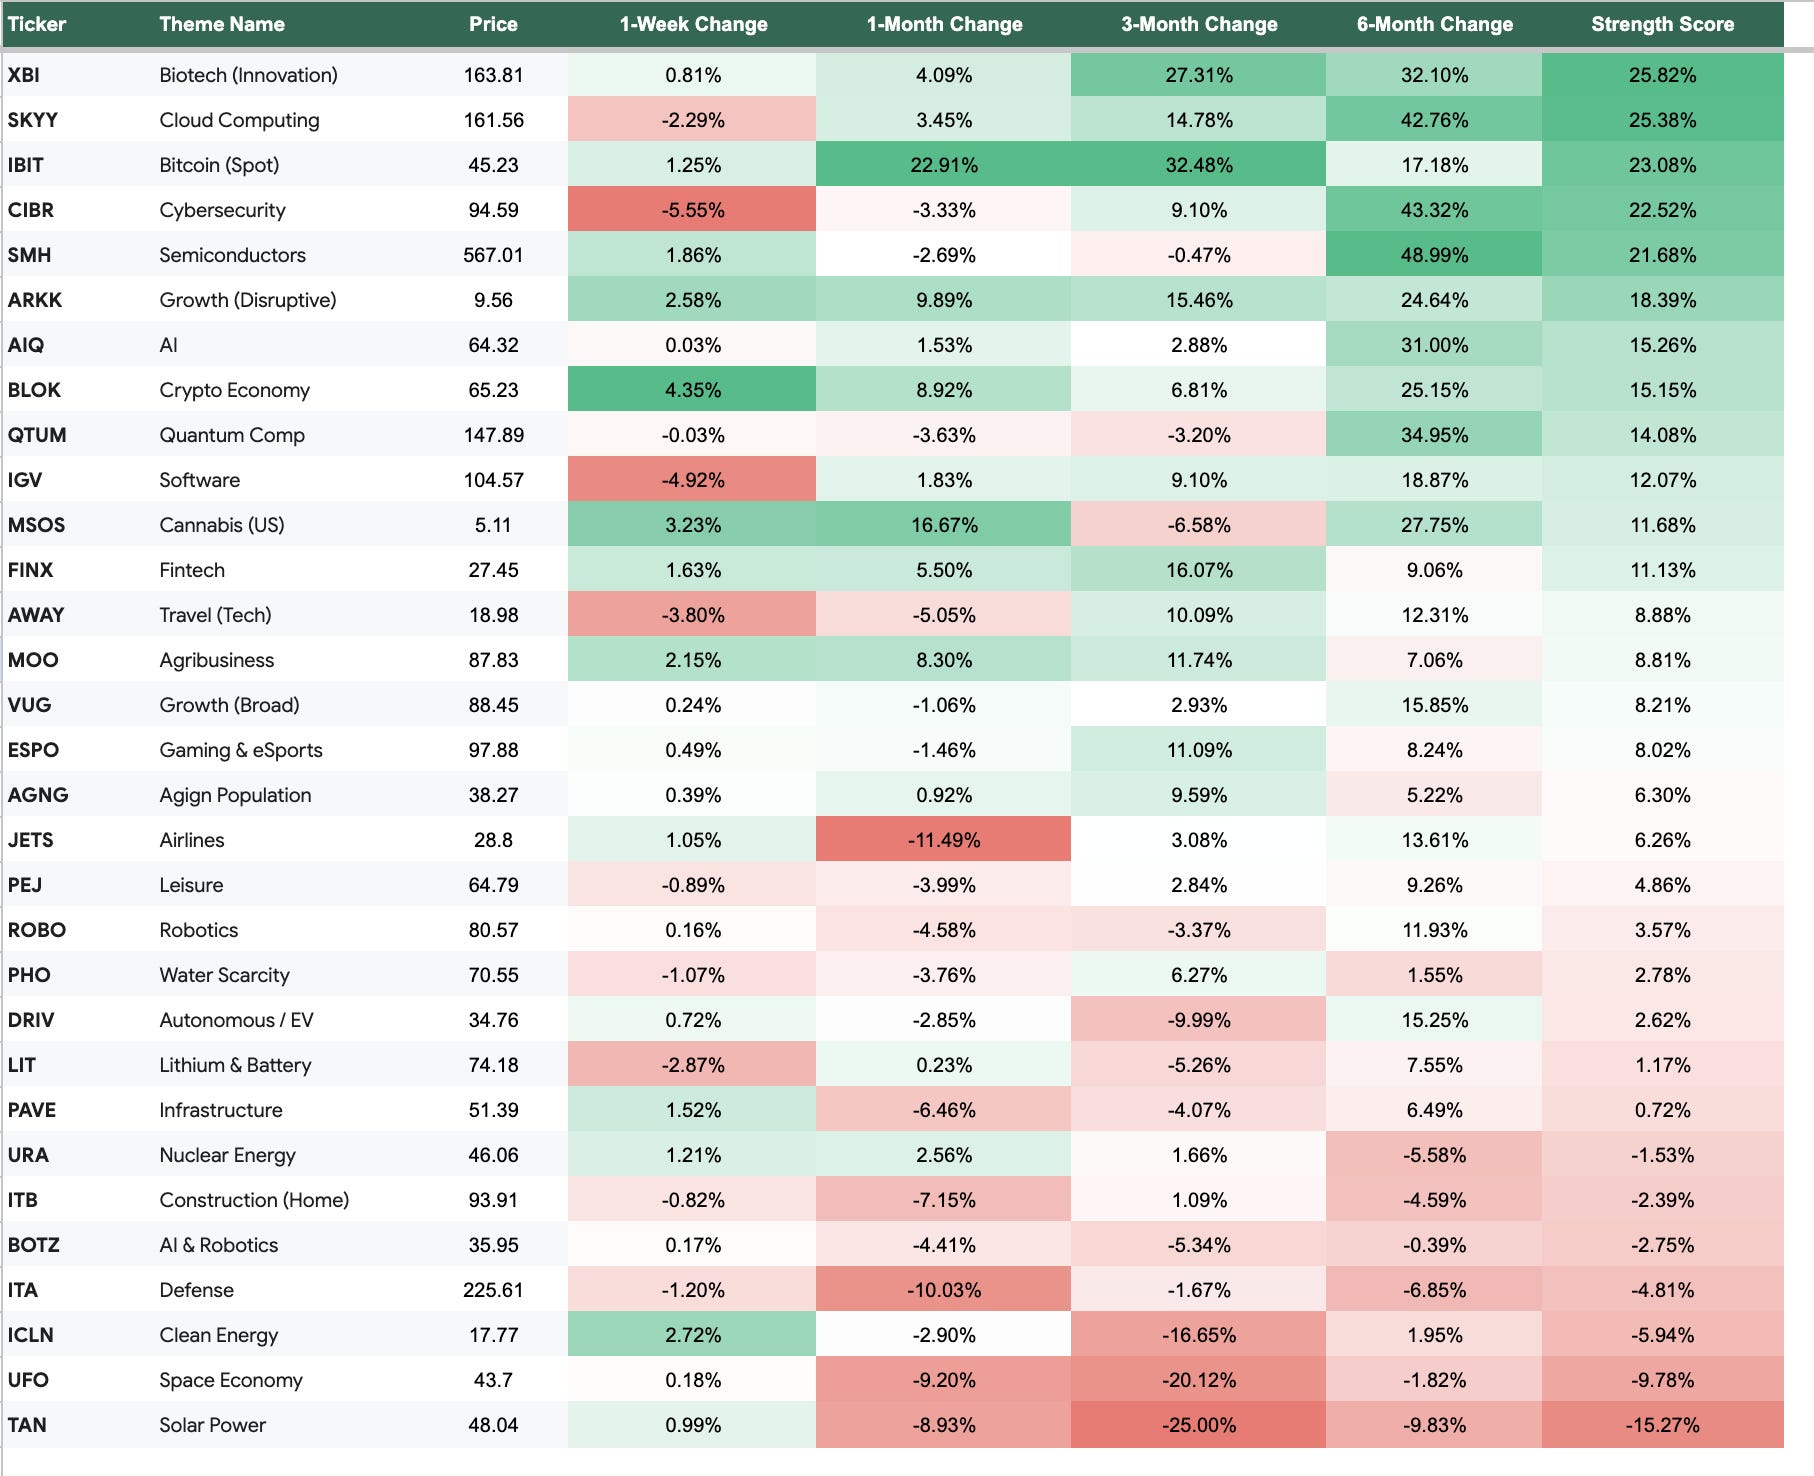
Semiconductors — flat over 3M, +49% over 6M
Biotech — +27.3% over 3M, +32.1% over 6M
Software — +9.1% over 3M, +18.9% over 6M
Cybersecurity — +9.1% over 3M, +43.3% over 6M
Two I’m watching:
● Semiconductors — up 49% in six months, flat for three. A long base under the strongest theme on my screen, with NVIDIA leading out. Breakout soon?
● Biotech — the highest strength score.
One oddity: defense is down 10% in a month while oil is up 34%. If this oil move were about war, defense would be bid. It isn’t. So the rally is demand-driven — which makes the inflation problem more persistent, not less.
💼 PORTFOLIOS
10X MOMENTUM
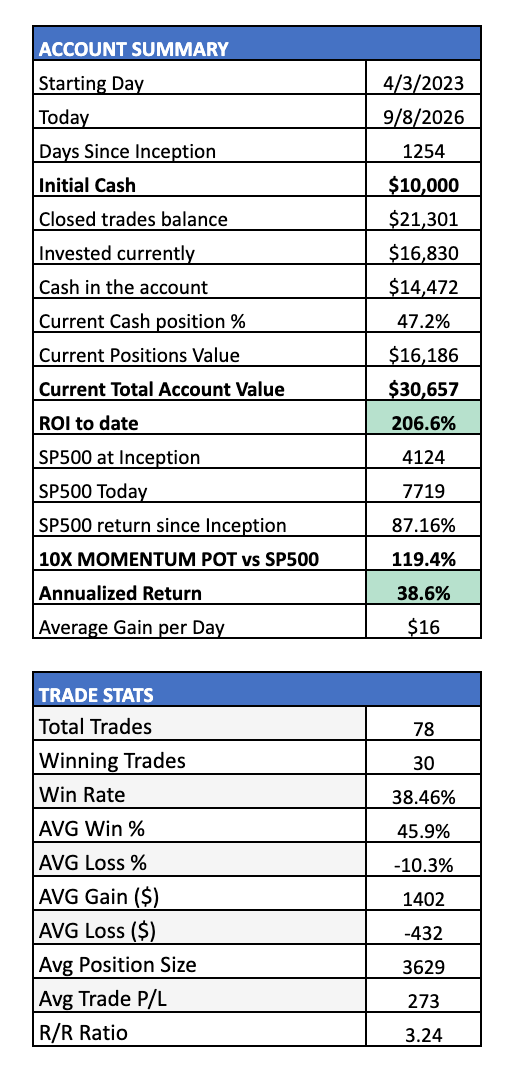
My buy-stop order on INR triggered — half a position. Nothing else to do this week. The portfolio as it stands today:

10X EASY DOUBLES
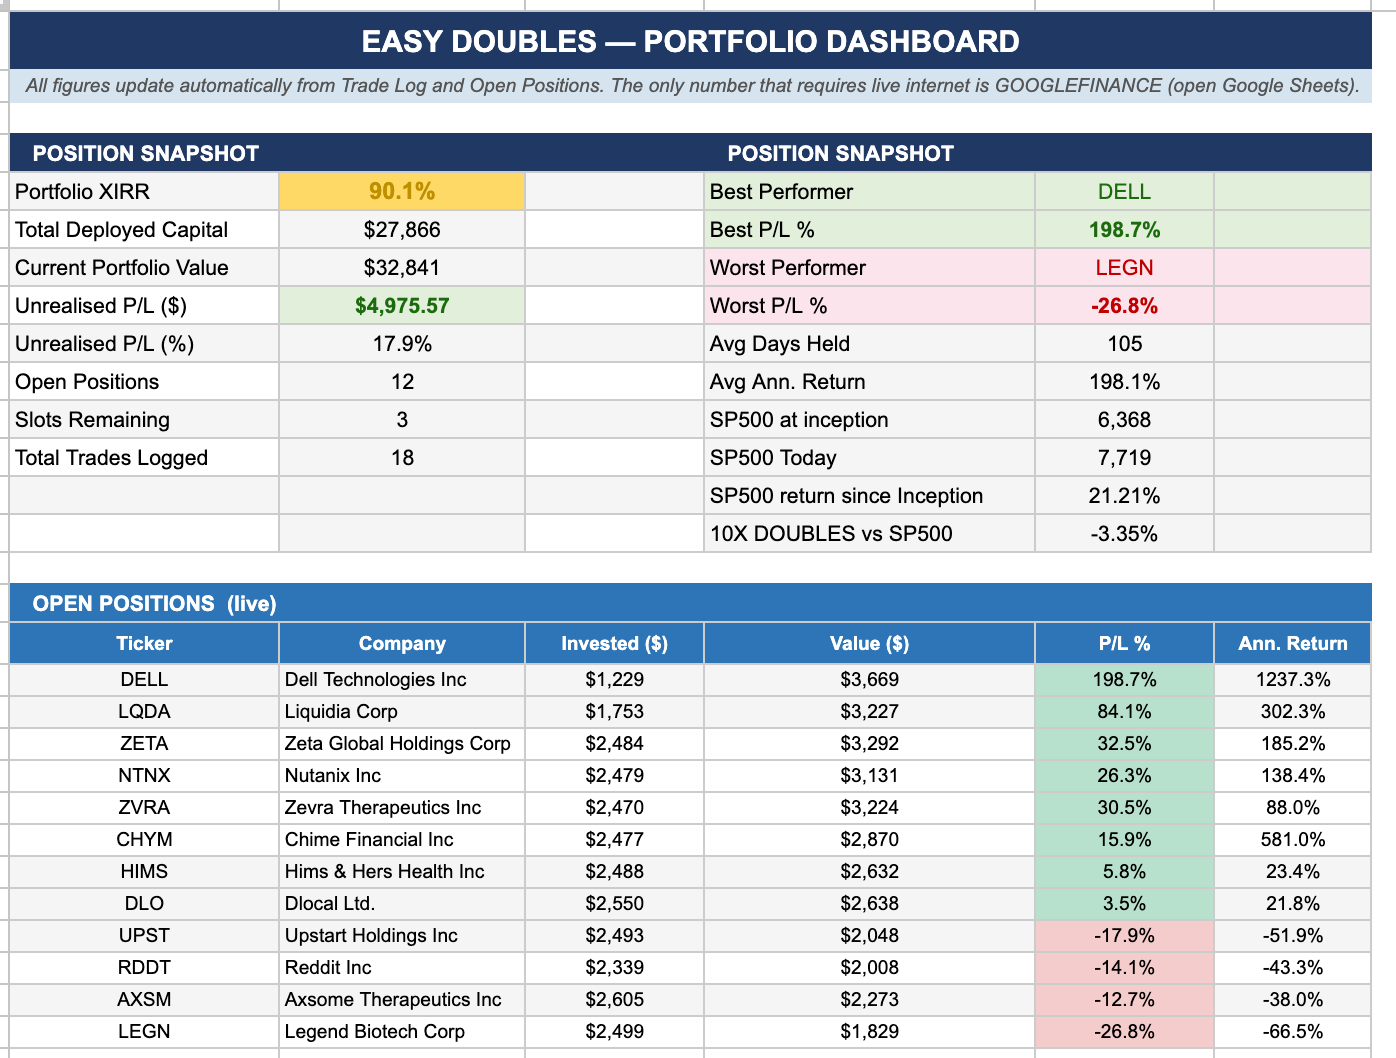
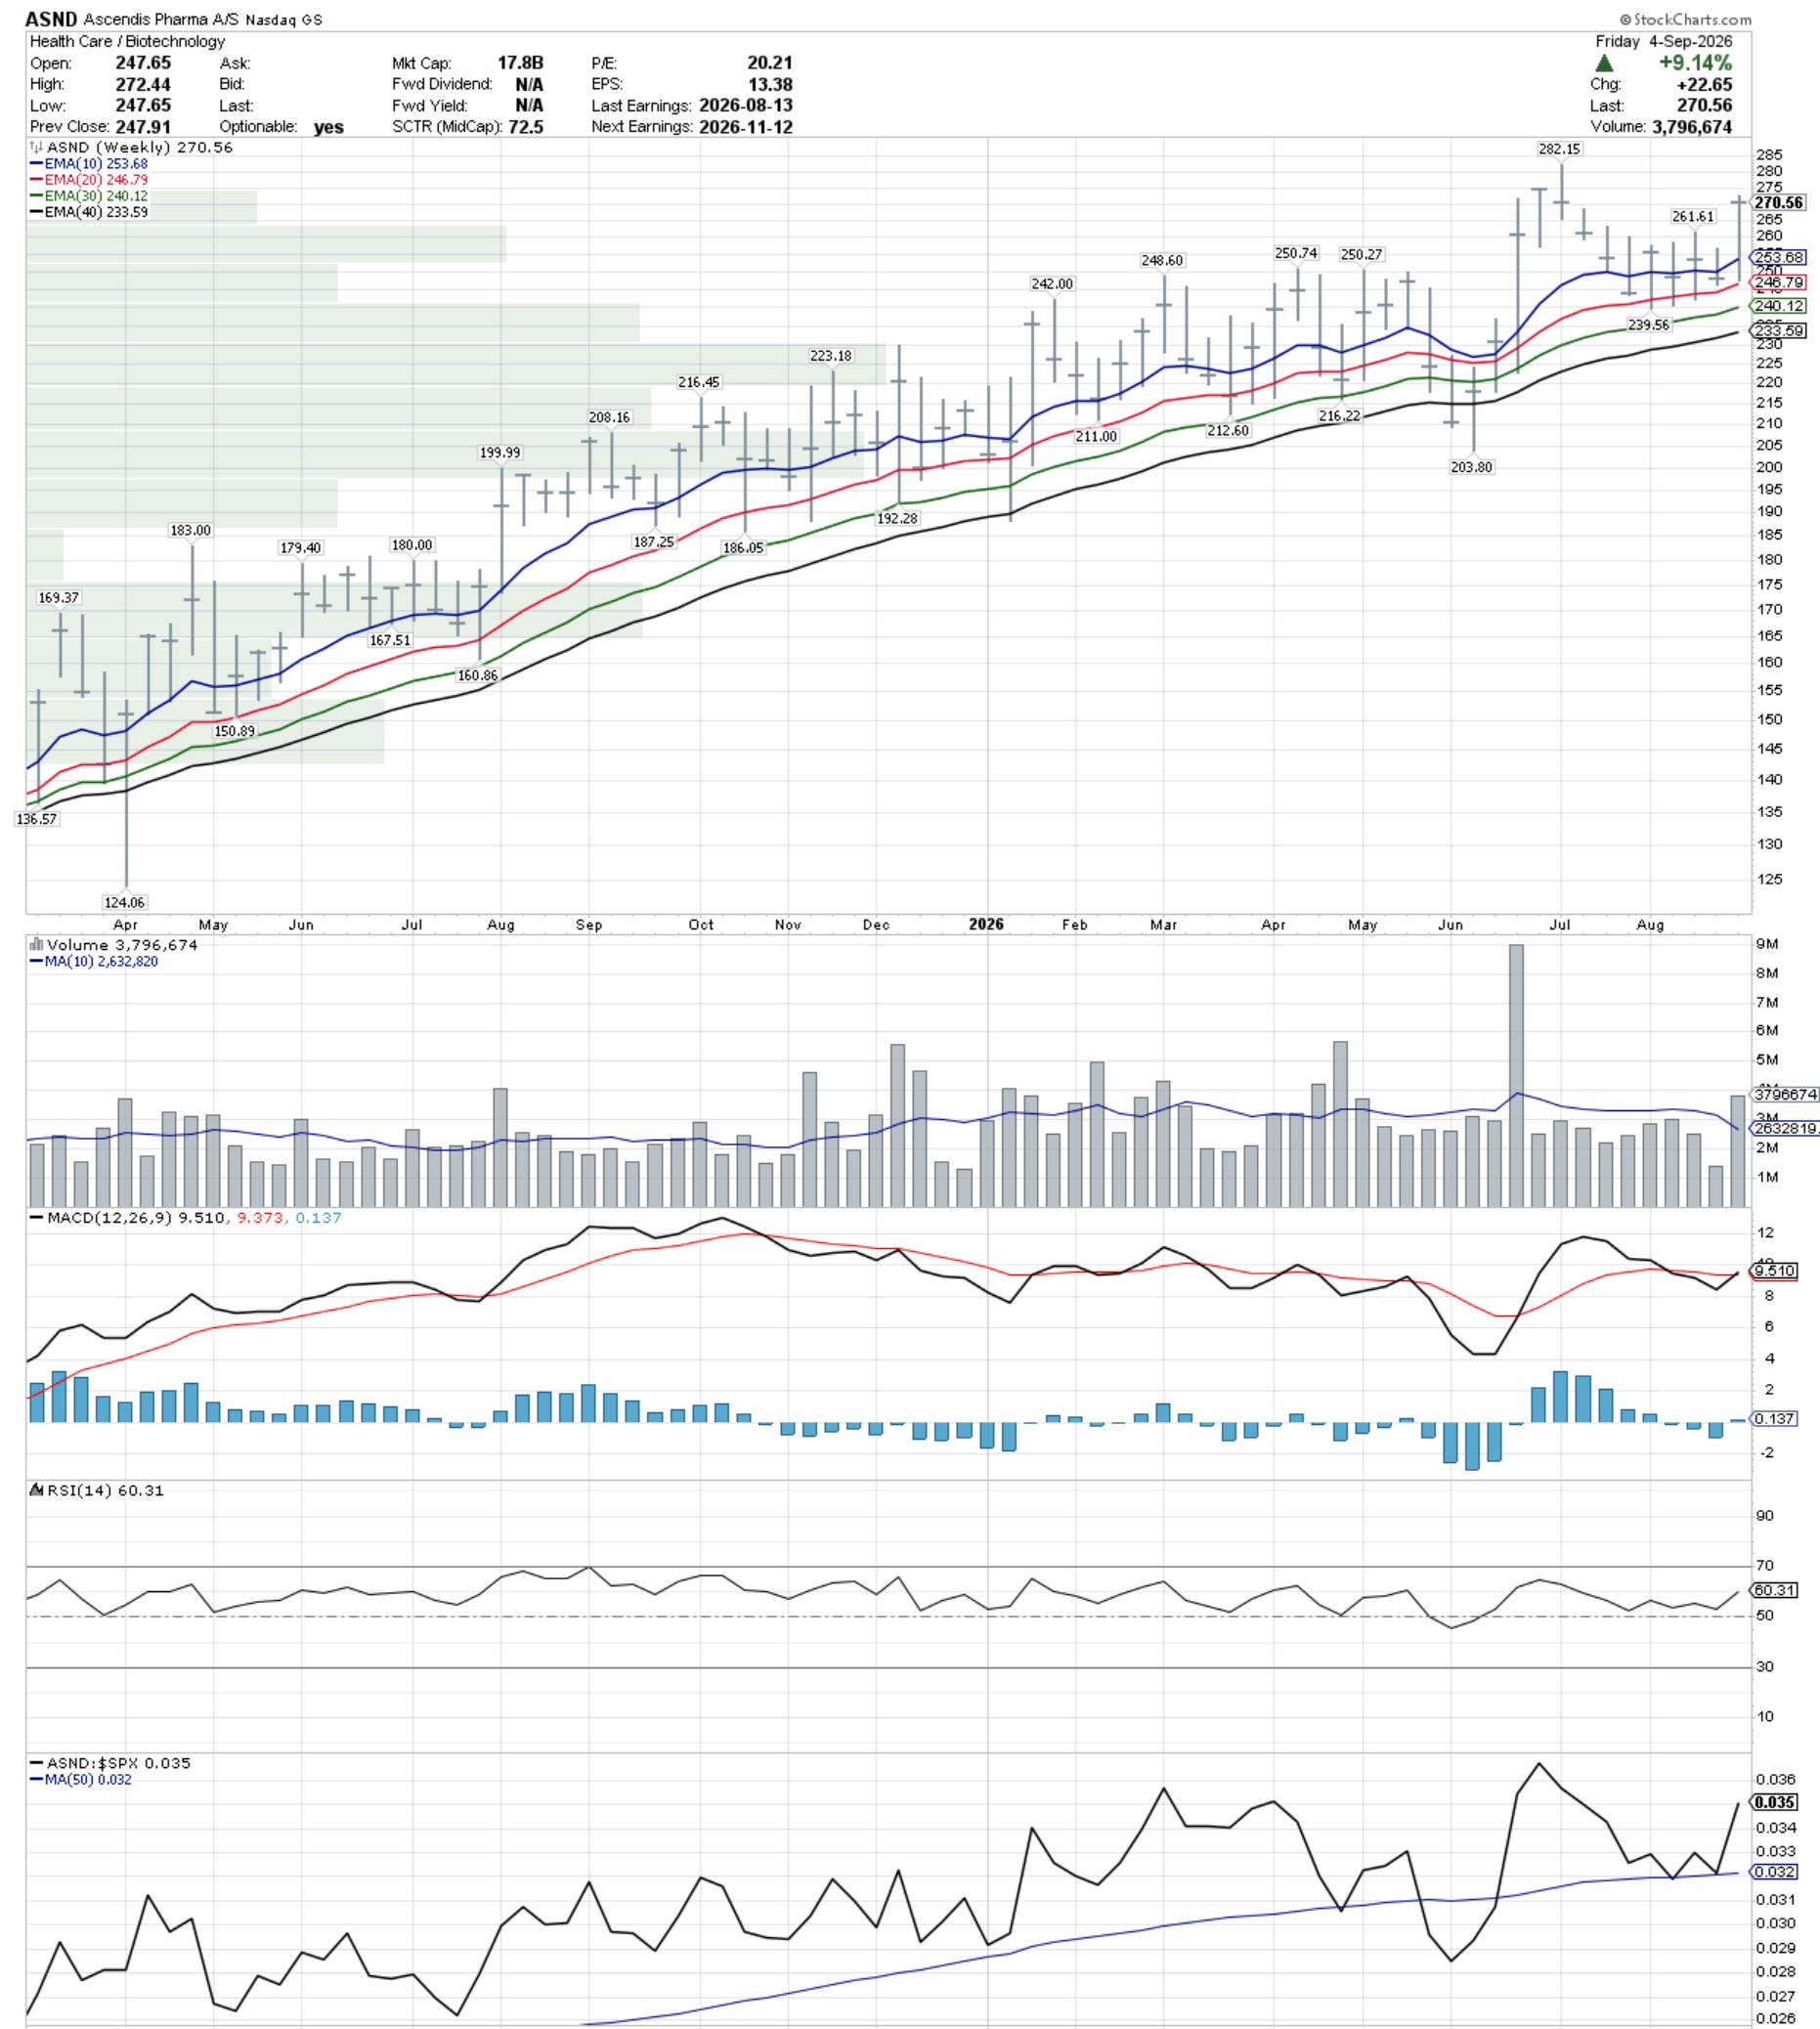
DELL has almost tripled since I added it. This week I’m adding ASND (Ascendis Pharma A/S) — 9 shares at the open. The portfolio as it stands today:
And here is the ASND weekly chart which I like:
Important: This is not investment advice. Please consult a licensed financial advisor before making any investment decisions. AI tools used for editing.