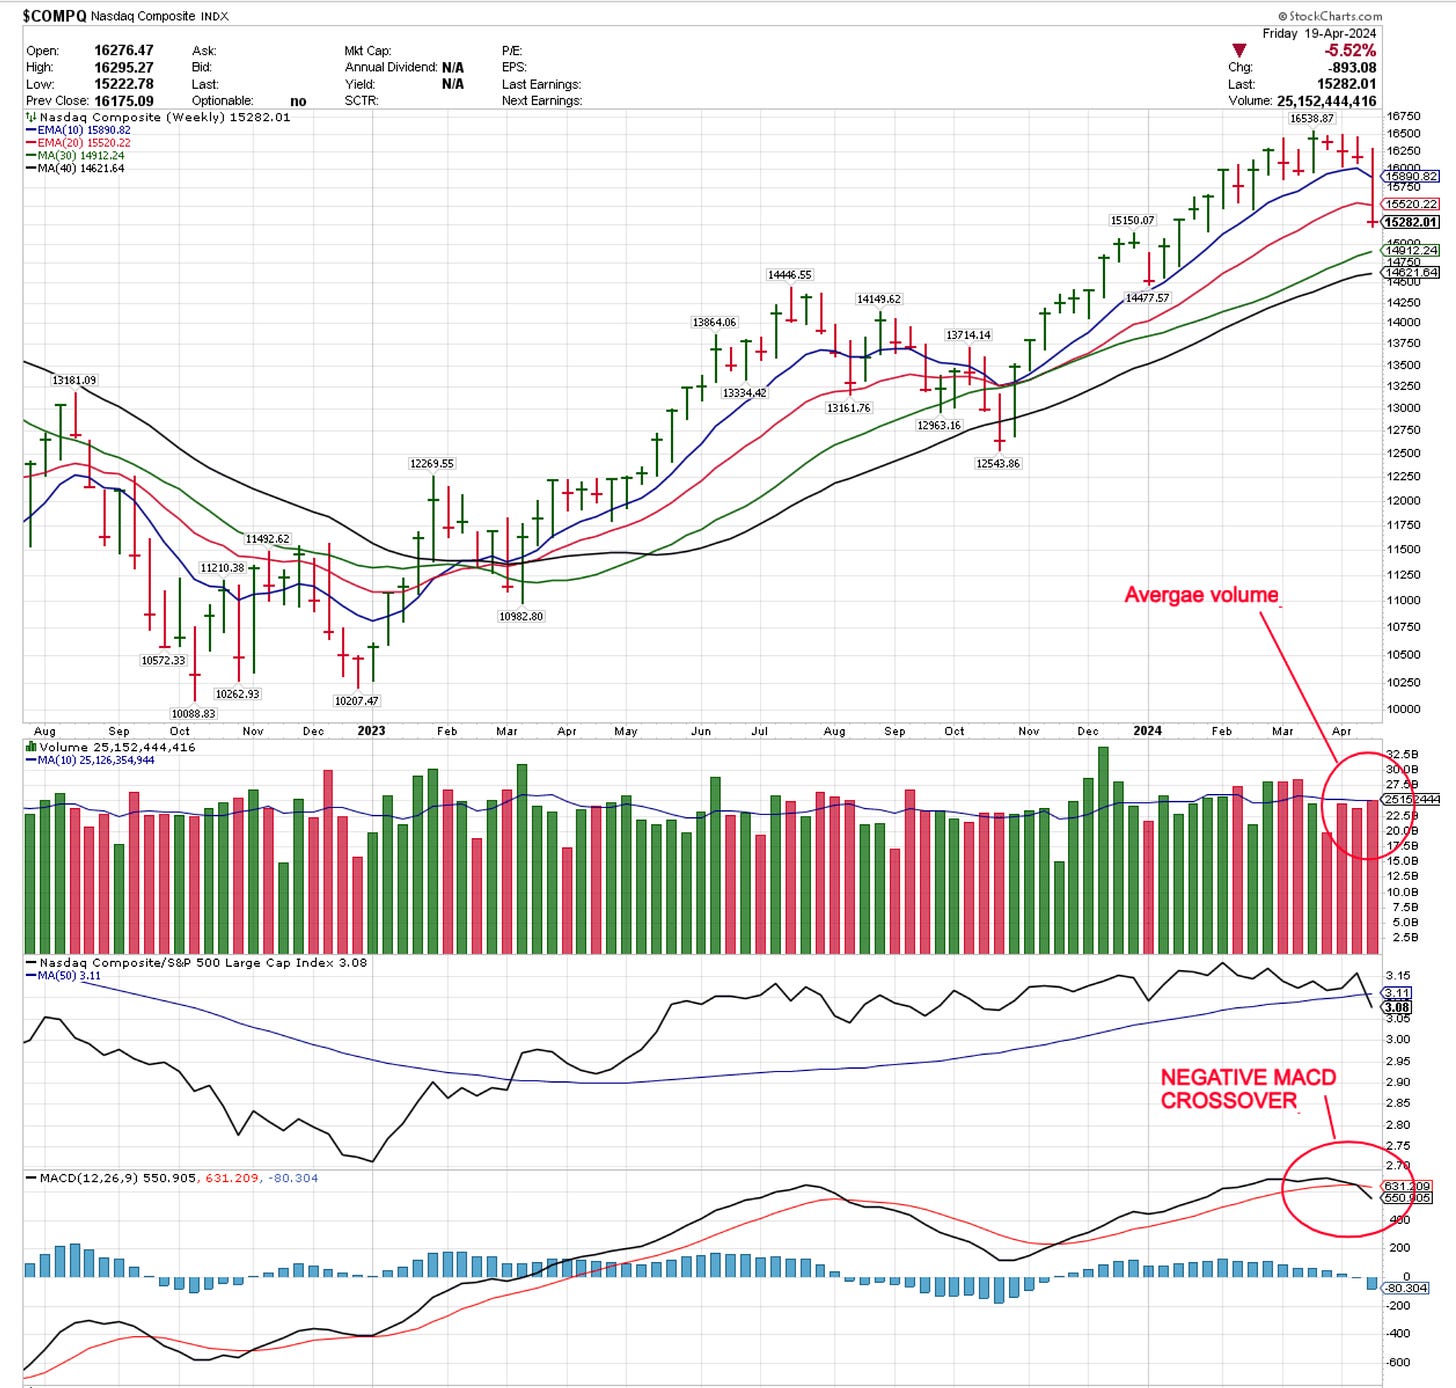
Well, it looks like the market has decided to go into a correction. Starting from the NASDAQ weekly chart:
The index has lost about 7.6% from its peak and although volume was not high, the weekly MACD crossed over signaling a momentum change. The 40-week moving average is about a further 4% below current levels and that should be an area of support.
My gauge indicator to assess market conditions on the daily chart looks like this right now:
Keep reading with a 7-day free trial
Subscribe to 10X CAPITAL POT to keep reading this post and get 7 days of free access to the full post archives.


